How we Automated Reporting for a Trading Firm (in 1 Week)
4 min read · Written on February 16, 2026 · Updated on February 28, 2026

A trading firm in Uttar Pradesh (India) reached out to us with a simple request.
“Can you help us stop doing this daily and weekly reporting in Excel?”
They trade corporate bonds. Every day, after the market closed, they would download data from NSE and BSE. Then the real work started. Cleaning the file. Removing securities they do not care about. Grouping different bond codes under the same company. Making charts. Writing notes. Saving and sharing the report.
It was not just boring work. It was heavy work. It ate up their evenings. Their weekends were worse. Saturdays and Sundays often went into building a full weekly view of the market.
That time should have gone into trading decisions. Not copying rows from one sheet to another.
So we built them a full automation system. It finished in one week. Much faster than they expected.
This article is about what we delivered, and why it worked.
What they were doing before
The workflow looked like this.
They downloaded two files every day. One from NSE. One from BSE.
Then they merged them. They removed “negative” scripts. These are securities they are not interested in. They also had to map bond codes to company names and sectors, because the market data is not always clean. The same company can appear in many different ways. The same issuer can have multiple instruments. A trader does not want to see 25 rows for the same company. He wants a clean company-level view.
After that, they built charts. Volume charts. Market share charts. Top traded companies. Biggest movers.
The weekly report was the hardest part. It was a full review of the week. Monday to Friday. Then compare it with the previous week. Then highlight what changed.
All of this was manual.
They did it because it was necessary. Not because it was the best use of time.
What they wanted from us
They wanted a dashboard that does this automatically.
Daily report
Weekly report
They also wanted to be able to generate reports for old dates. Any previous day in the quarter. Any previous week in the quarter. That matters a lot in trading. Sometimes you want to look back and understand what happened before making a move.
They wanted two key controls.
First, a “negatives” list. Trades they do not want in the report.
Second, a company and sector mapping. So bond codes get grouped under the right company.
That was the base request.
We delivered that. Plus a lot more.
Step 1: Daily automation to collect market data
We set up an automated job that runs every weekday after market hours.
It pulls corporate bond trading data from both NSE and BSE. It parses the files. It stores trades in a Supabase database table.
This removed the daily “download and clean” work completely.
Step 2: Alerts after every run
Automation is useless if you do not know when it fails.
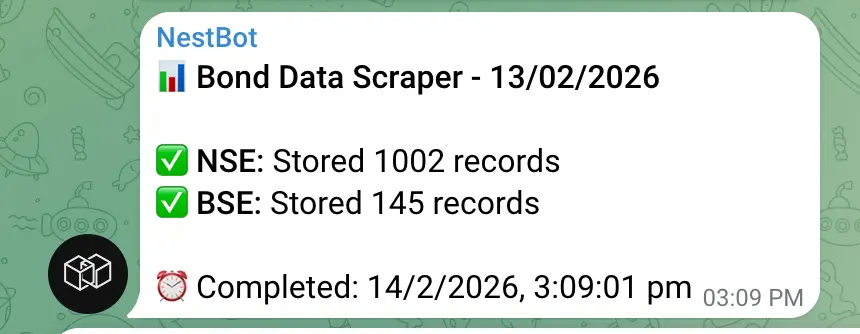
So we added Telegram alerts. Every day, after the job runs, the client gets a message.
It tells them how many records were scraped. It tells them if there was any error. If something breaks, they know immediately.
This is important because BSE changes their site often to prevent bots and scrapers. So, scraping can break without warning.
Step 3: Manual upload fallback (so the client is not stuck)
This is where we went beyond the requirement.
The client was okay with calling us if scraping breaks. Many clients accept that. We did not.
If their reporting system depends on us fixing scripts, that is a business risk. Trading does not wait.
So we added a manual upload module inside the dashboard.
If NSE or BSE scraping fails, they can download the CSV report themselves from the exchange website. Then upload it to the dashboard.
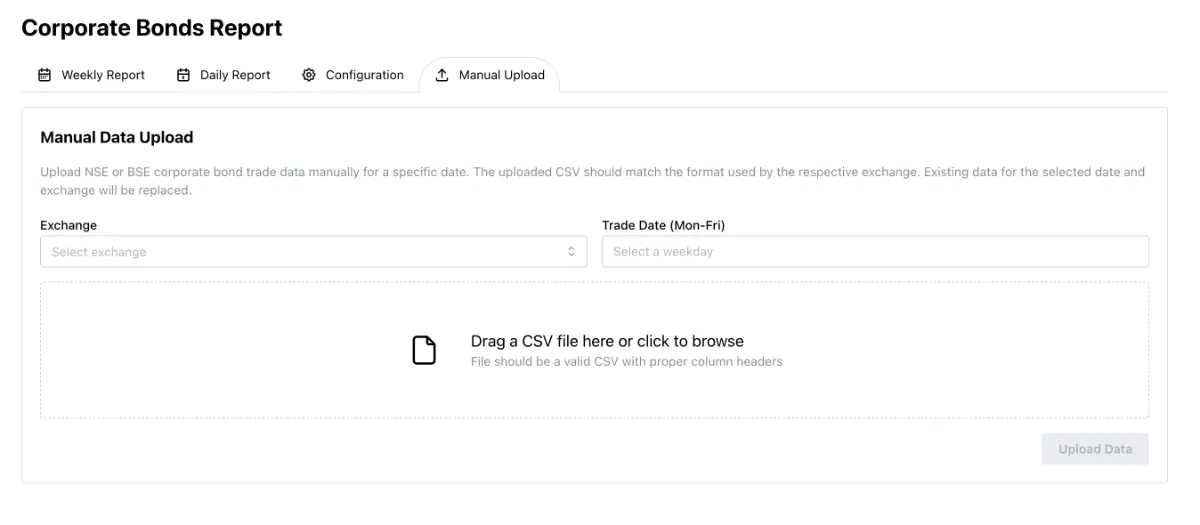
The system automatically parses the file the same way the automation does. It deletes existing records for that date and exchange. Then inserts the new data. Clean and correct.
This gave the client independence. They do not have to pause operations.
Step 4: Config screens inside the dashboard (no code changes needed)
The client originally expected us to hardcode the negatives list and the company mapping in code.
We could have done that. It would have worked on day one. But, we knew that it would later become a pain for the client, and we didn't want that to happen.
Bonds change. New series come in. Old ones stop trading. Someone adds a new issuer. Or a new bond code appears. If mapping is hardcoded, they have to message the developer every time, and spend their hard earned money on something that is so easy to automate.
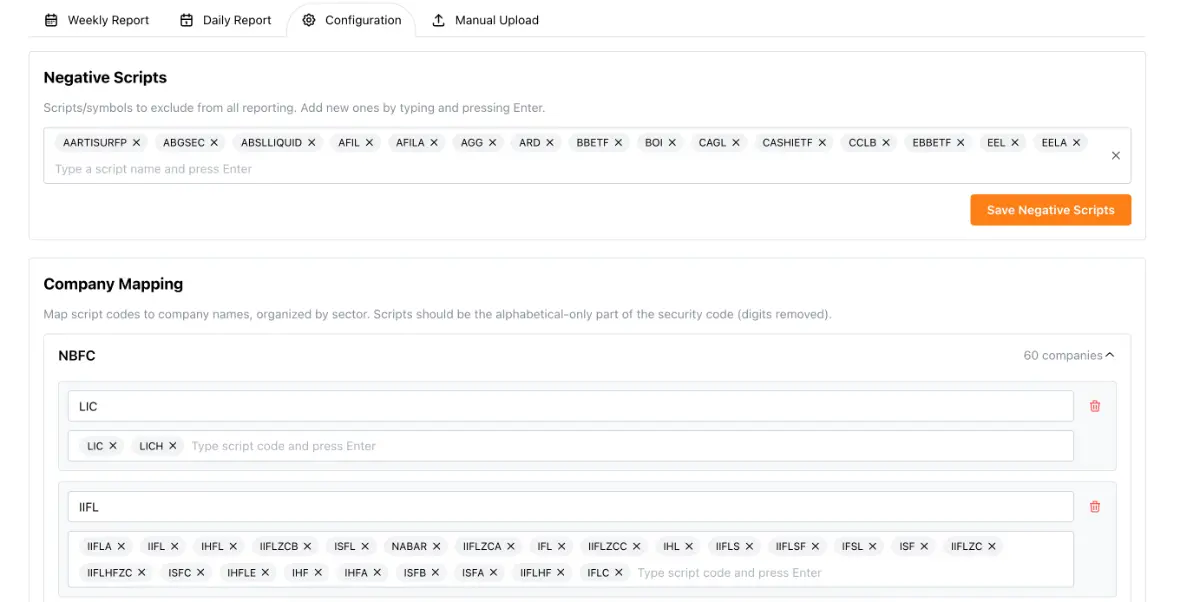
So we added configuration screens inside NEST.
NEST is our admin panel product. We include it for free with K34a projects because it makes operations easier.
Inside NEST, the client can:
Add or remove negative scripts using a simple tags input
Maintain a sector → company → scripts mapping using a form UI
Get alerts when a script is traded but not mapped
That last point is key. If a new security code shows up in market data, the dashboard flags it. The client sees the top unmapped scripts. Then they can add them into mapping in seconds (not even minutes).
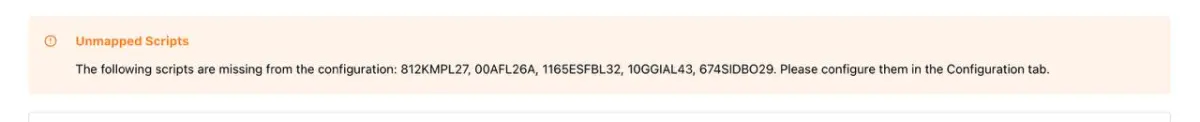
No waiting. No support tickets. No deployments.
Step 5: The reporting dashboard (daily and weekly)
This is what the client really wanted to use.
They got two report views.
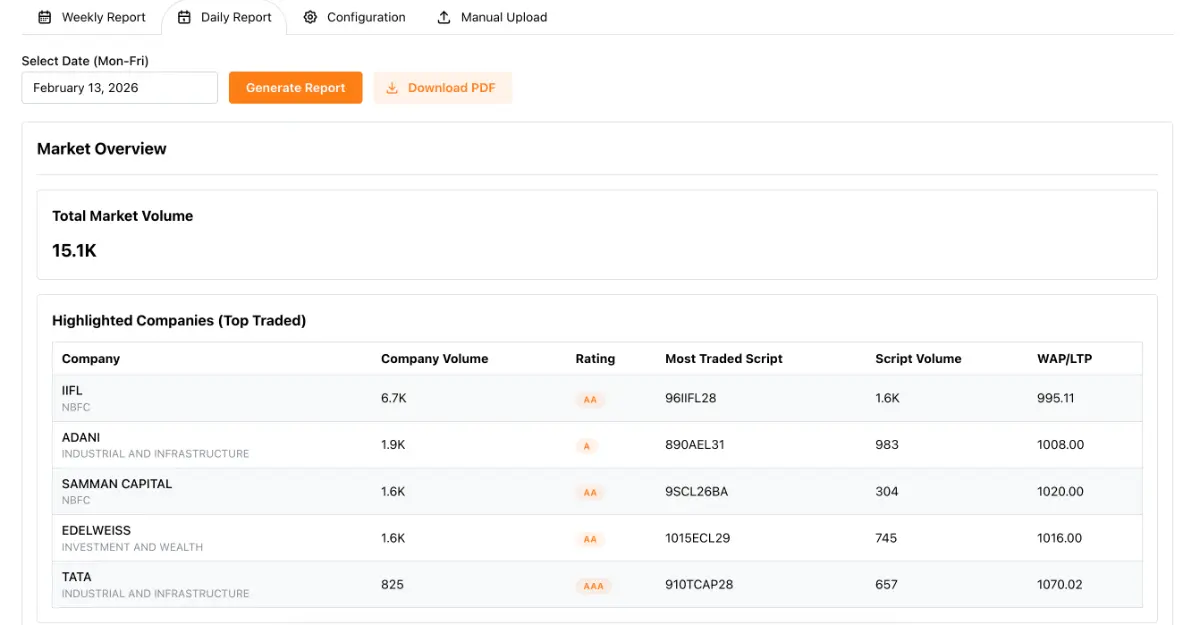
Daily report
The daily report gives a quick summary for one trading day.
It shows:
Top traded companies by volume
Their credit rating (extracted from raw strings)
Their most traded bond script
Company volume and that script’s volume
WAP or LTP prices (and exchange handling)
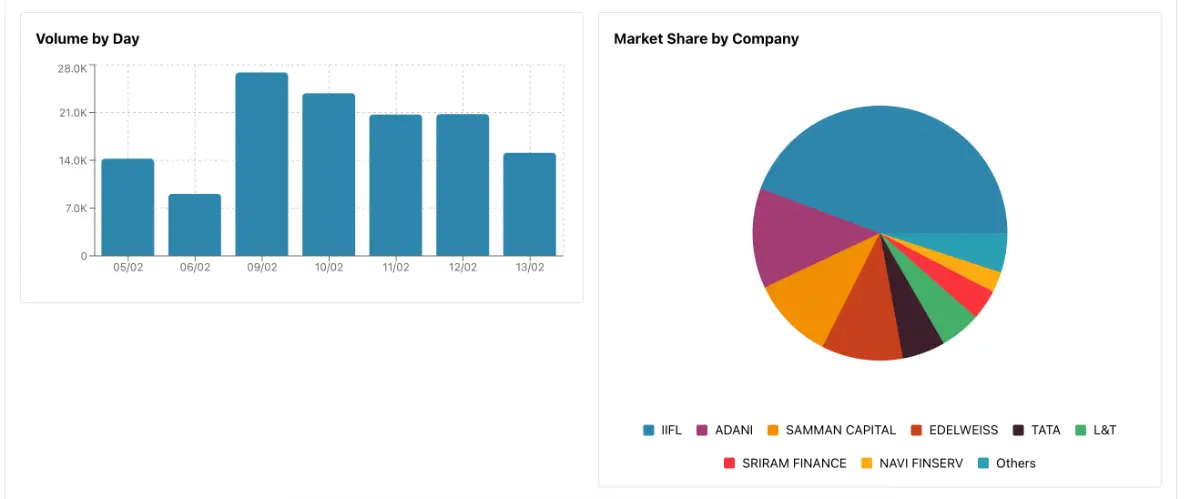 It also shows charts that help you understand the day fast:
Volume history for recent days
Market share distribution by company
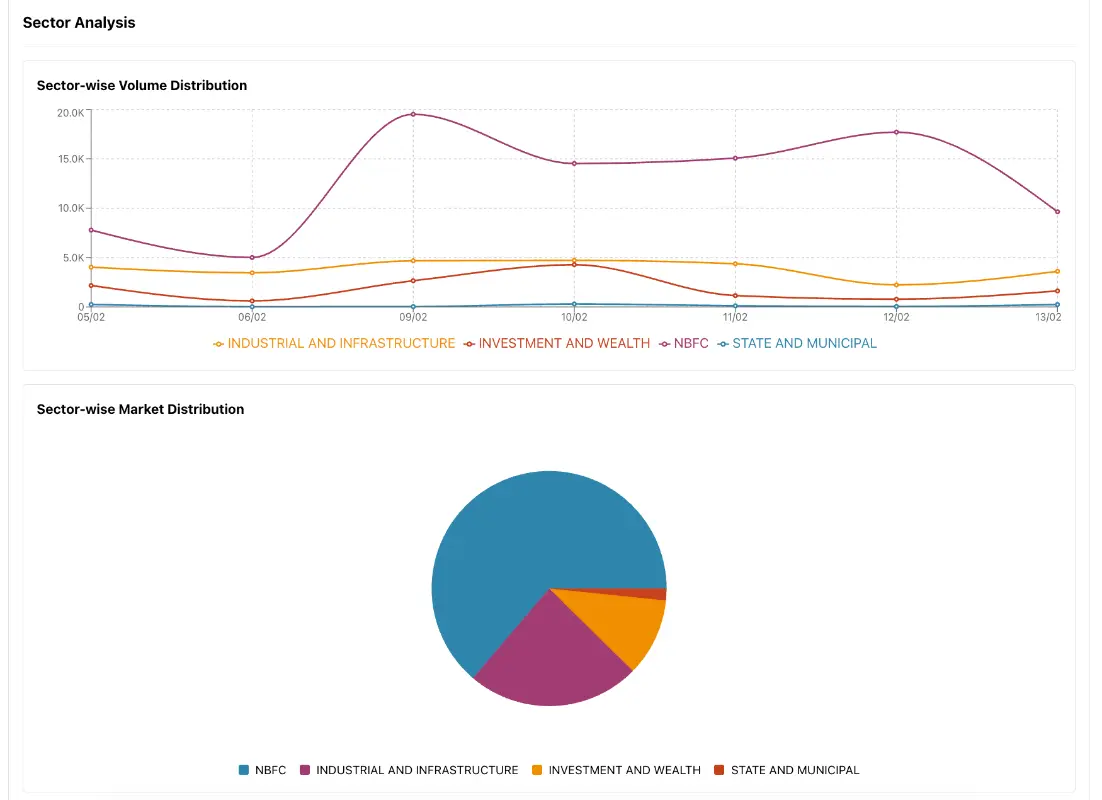
Sector distribution and sector market share
Then comes the section traders like most.
Market movers.
Volume risers
Price risers
Price decliners
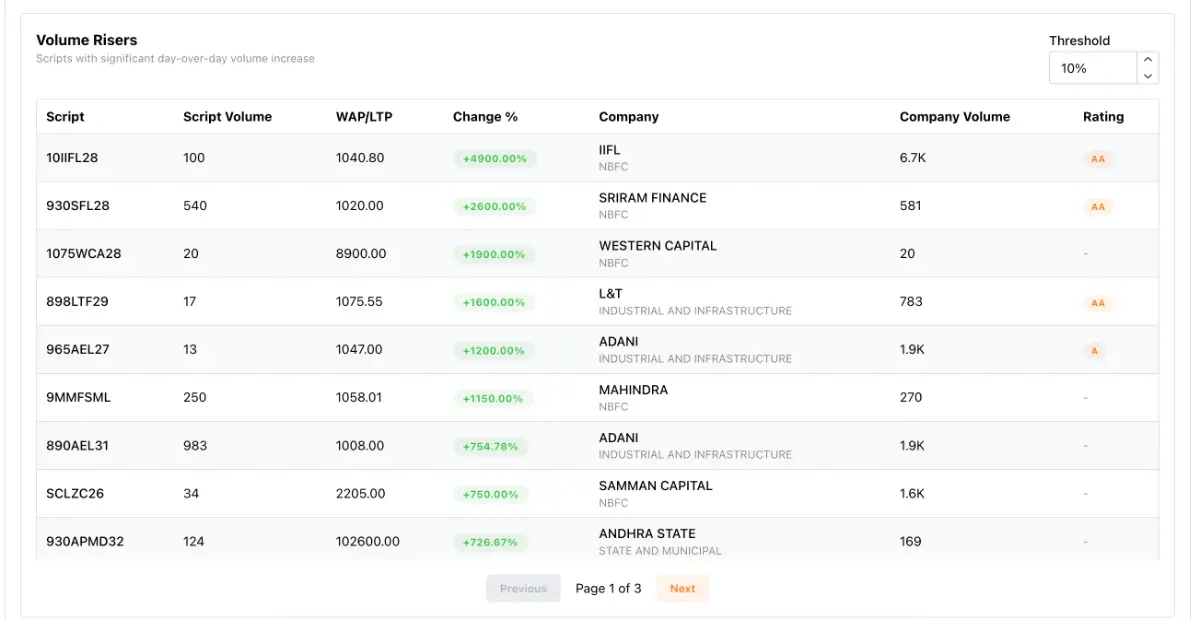
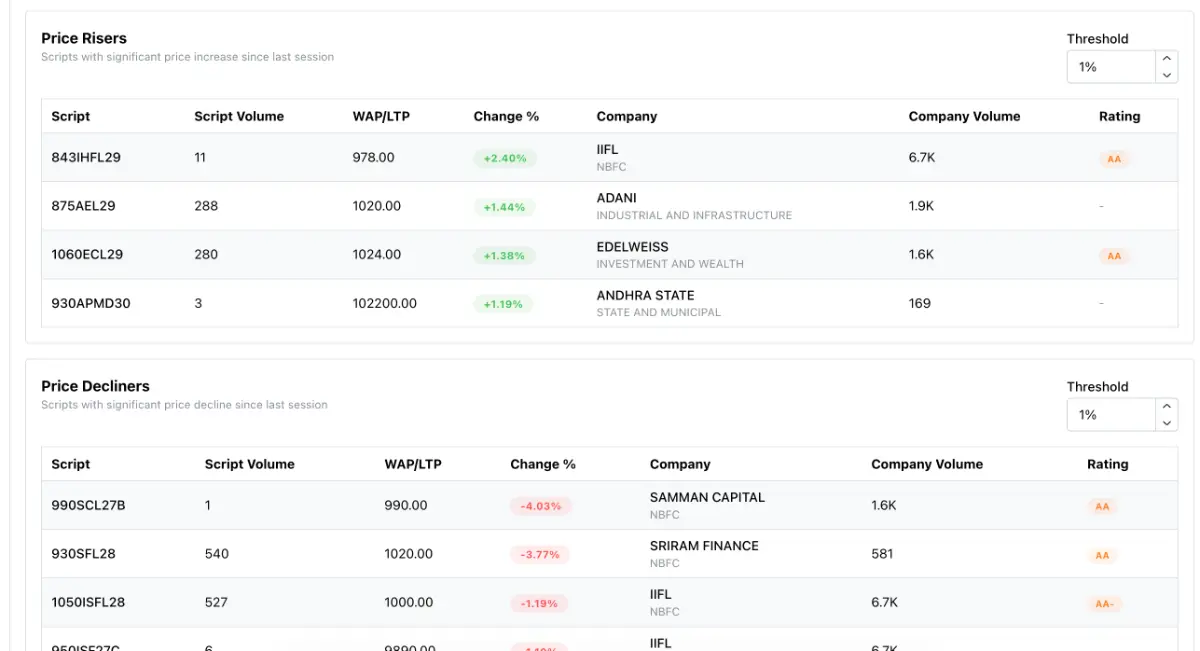
These help spot changes quickly. You can adjust the threshold to focus only on meaningful moves.
Weekly report
Weekly is Monday to Friday. It gives a bigger market view.
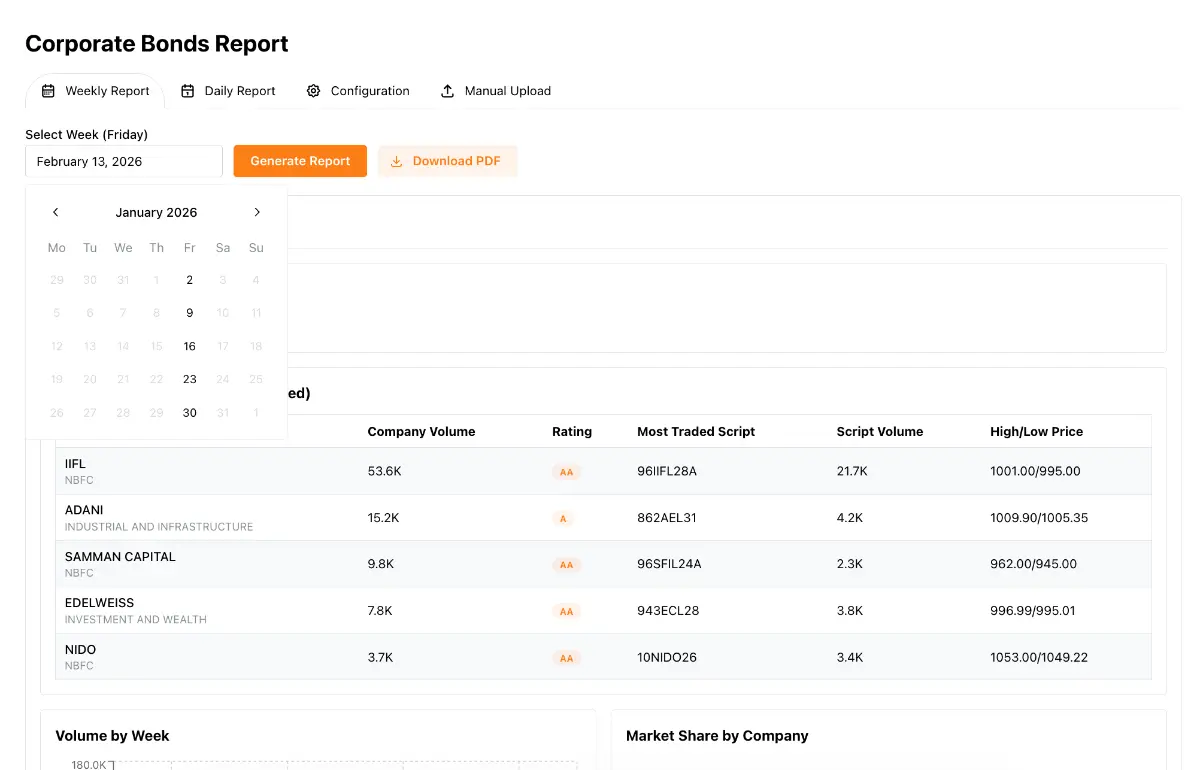
It shows:
Top traded companies for the week
Weekly high and low prices
Four-week volume view (so you can see if the market is heating up or cooling down)
Company market share
Sector trends
Movers week-over-week
The client no longer spends weekends doing this.
It is one click.
Step 6: Smart rules that match how the market works
Some details sound small. They matter a lot in real data.
If a bond trades on both NSE and BSE on the same day, we merge volumes
For price fields, we prioritize NSE values when available
We normalize script names for matching
Credit ratings get cleaned into usable values like A, AA, BBB
Unmapped scripts get highlighted so the config stays fresh
We also made sure the UI is easy to read. Finance people do not want a cluttered page. So we reorganized the dashboard into clear sections:
Market Overview. Trading Analysis. Market Movers. Sector Analysis.
Step 7: PDF download from the dashboard
The client sometimes shares reports internally. Sometimes they want to save it.
So we added a “Download PDF” button on both daily and weekly reports. It uses the browser print-to-PDF flow. Fast and reliable. No extra dependencies.
Delivered in 1 week
The most common response we got was:
“I thought this will take much longer.”
It took one week because we used NEST as the base, and then built the reporting layer on top of it.
That is also why we include NEST for free. It reduces time. It improves the final experience.
What changed for the client
Before this, their reporting work was daily and weekly manual labor.
Now:
Data collection is automatic
Failures are alerted instantly
Manual upload exists as backup
Mapping and negatives are editable in the dashboard
Daily and weekly reports are available for any historical date
Reports are clean, grouped, and readable
They can download and share PDFs quickly
Most importantly, their time is back.
They can focus on trading decisions.
Why this matters for other trading firms
If you trade corporate bonds, you already know this pain.
The data is messy. The reports are repetitive. The analysis is time-sensitive. Excel works, until it does not. Then it starts costing you time and attention.
If you want something similar for your desk or your firm, K34a can build it for you. Fast. Practical. Built around your workflow.
And you get NEST with it, so your team can run the system without depending on developers for every small change.
So, tell us your current workflow, and we help you map it into a custom and fully automated dashboard like this.